
How to Look Up San Diego County Jail Population Data
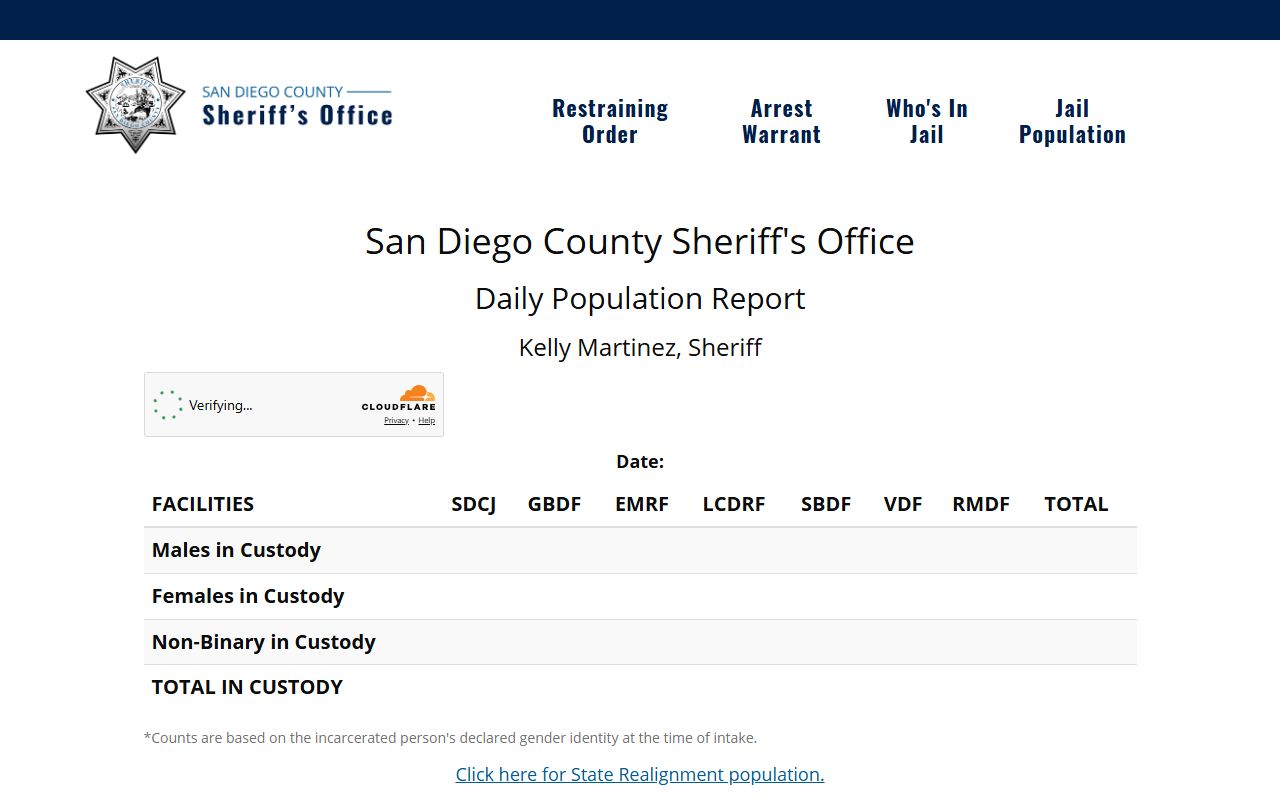
The official source is the Sheriff's Daily Population Report at apps.sdsheriff.net/Inmatepopulation/. The page refreshes each day. It shows counts for the seven Sheriff jails plus a system total. The dashboard breaks numbers out by gender identity at intake. Three columns show males, females, and non-binary people in custody, with one more row for the grand total.
The table reads left to right by facility. Codes used on the dashboard are SDCJ for San Diego Central Jail, GBDF for George Bailey, EMRF for East Mesa Reentry, LCDRF for Las Colinas, SBDF for South Bay, VDF for Vista, and RMDF for Rock Mountain. A side link sends users to State Realignment population data, which tracks people sent to county jail under AB 109 rather than to state prison. Counts on the dashboard are official Sheriff figures, not estimates. Live counts can drift through the day as bookings and releases hit the system.
For lead-in context on the daily counts, the page below shows the live Sheriff dashboard.
Hard-copy snapshots and historic series come from the Detention Services Bureau, which posts annual State of the Jails updates and budget briefings. National and state baselines come from the federal Bureau of Justice Statistics (BJS) and the Vera Institute of Justice. These are the standard cite sources for any jail rate stated per 100,000 residents.
San Diego County Jail Capacity Overview
The Sheriff runs seven jails across the county. Combined average daily population sits above 5,000. The system books, classifies, houses, and releases about 100,000 people per year. Each facility has its own design type. Some sit near downtown court complexes for high-security holds. Others are larger and serve lower-risk people serving short sentences or in reentry programs.
| Facility | Rated Capacity | Function |
|---|---|---|
| San Diego Central Jail (SDCJ) | Not posted | Primary male intake; pre-arraignment; medical and psychiatric. |
| Las Colinas Detention and Reentry Facility (LCDRF) | 1,280 | Primary female intake; open booking; reentry. |
| East Mesa Reentry Facility (EMRF) | 760 | Medium security; reentry; work, education, job skills. |
| South Bay Detention Facility (SBDF) | 386 | Non-booking; under South Bay Regional Justice Center. |
| George Bailey Detention Facility (GBDF) | Not posted | Otay Mesa detention facility. |
| Rock Mountain Detention Facility (RMDF) | Not posted | Otay Mesa detention facility. |
| Vista Detention Facility (VDF) | Not posted | North County detention facility. |
Las Colinas is the largest facility by posted bed count. It opened in August 2014 on a 45-acre site in Santee and uses an open booking model in which people sit in an open area and are called for medical screening and intake steps rather than waiting in holding cells. The Central Jail opened in May 1998 at 1173 Front Street, with 417,000 square feet across 11 floors and 17 levels. It is also the largest acute psychiatric treatment site in the county. Some Sheriff facility pages did not list rated capacity in the text capture, but they are listed in the Detention Bureau's own count of seven jails. For each individual facility profile, see the Sheriff site pages for East Mesa Reentry, Las Colinas, and San Diego Central Jail.
Average Daily Population
The Sheriff's Detention Services Bureau states that combined average daily population (ADP) across the seven jails is more than 5,000. ADP is the standard metric used by jail planners. It is the mean of the daily counts across a month or a year. ADP smooths out spikes from a busy weekend or a slow holiday week. The Sheriff homepage "By the Numbers" panel tracks yearly booking volume as well, and the 2023 dashboard metric shows that bookings into custody fall in the same six-figure range cited in the bureau's own page.
The ADP figure is used to plan staff shifts, food orders, transport runs, court appearance windows, and medical care. Capacity per facility, plus the ADP across all sites, drives if and when the county talks about new beds, new programs, or release reforms. The number can also shift due to factors set outside the jail itself, such as court backlog, pretrial release rates, the use of cite-and-release for low-level cases, and shifts in state law on what counts as a felony versus a misdemeanor.
Demographic Breakdown
The Sheriff's Daily Population Report posts a gender split based on declared gender identity at intake. Three categories appear on the dashboard. Detailed race and age breakdowns are not posted on the live dashboard. Those numbers live in budget briefings, grand jury reports, and BJS data submissions.
| Group | Source / Notes |
|---|---|
| Males in Custody | Daily dashboard column; primary intake at San Diego Central Jail. |
| Females in Custody | Daily dashboard column; primary intake at Las Colinas. |
| Non-Binary in Custody | Daily dashboard column; based on declared gender identity at intake. |
| Race | Not on live dashboard; published in budget and grand jury reports. |
| Age | Not on live dashboard; some age bands cited in Detention Bureau briefings. |
The Sheriff notes that the gender count is based on the person's own declared gender identity at intake. Race and age data, when posted, come out in the State of the Jails update and in grand jury reviews. Those reports also flag long-term shifts, such as growth in the share of people in custody who have a serious mental health flag at booking.
Pretrial vs. Sentenced Population
Jails hold two main groups. Pretrial holds people who have been booked but not yet had their case end. Sentenced holds people serving a county jail term, often a misdemeanor or a felony eligible for local time under California Penal Code 1170(h). National BJS data shows that most U.S. jail beds hold pretrial people. The exact San Diego split shifts by month and is not posted as a live tile on the Sheriff dashboard.
| Status | Typical Share (national BJS context) |
|---|---|
| Pretrial | About 70% of U.S. local jail population (BJS Jail Inmates series). |
| Sentenced | About 30% of U.S. local jail population (BJS). |
| San Diego specific | Not posted on the live Sheriff dashboard; see Detention Bureau State of the Jails update. |
Pretrial holds drive bed pressure the most because they are the least planned. A person booked at 2 a.m. takes a bed within an hour. A sentenced person, by contrast, comes in on a known surrender date. Pretrial release reforms, bail rules, and county pretrial services all push or pull this share. The Sheriff lists Pretrial Services under its Reentry Services group, which can shift who waits in custody for trial.
Misdemeanor vs. Felony Population
Most jail beds across the state hold people facing felony charges or serving felony jail terms. Misdemeanor holds tend to be shorter. Many low-level misdemeanors are cited and released on the street and never reach the jail. Under California's 2011 realignment (AB 109), people who get a felony jail term for a non-violent, non-serious, non-sex offense often serve that time in county jail instead of state prison. That law shifted thousands of people from CDCR custody to county jails such as San Diego's.
The Sheriff's dashboard does not split the live count by charge class. The Detention Bureau's State of the Jails updates do report broad shares, and the county budget shows that the jails fund medical, mental health, food, counseling, recreation, religious, education, and job training services scaled to a felony-heavy population. East Mesa Reentry, in particular, is built for lower-classification sentenced people with work and education needs.
Mental Health and Medical Population
The Sheriff says San Diego Central Jail is the largest acute psychiatric treatment site in the county. That means a sizable share of the in-custody population gets some form of mental health care during their stay. Pretrial holds with a mental health flag often route to SDCJ. Sentenced people with ongoing needs may shift to East Mesa or Las Colinas based on classification.
Medical care covers screening at intake, daily sick call, urgent care, chronic care for diabetes and heart conditions, dental, and end-of-life or hospice referral. The Detention Bureau lists medical, mental health, food, counseling, recreation, religious, education, and job training as core in-custody services. The grand jury and the Citizens' Law Enforcement Review Board both review use of force, custody deaths, and care standards in the jails. Those reports flag the share of in-custody people with mental health needs.
National and State Context
The standard yardstick for jail population is people held per 100,000 residents. The federal Bureau of Justice Statistics (BJS) publishes the Jail Inmates series each year, which gives a national rate. The Vera Institute of Justice tracks county-level jail incarceration rates and trends. Together they give a way to compare San Diego County to the state average and to the U.S. as a whole.
| Level | Jail Population per 100k (context) |
|---|---|
| United States (BJS) | Roughly 200 per 100,000 residents in recent BJS Jail Inmates series. |
| California (BJS / state data) | Lower than the U.S. average; California tracks closer to the mid-100s per 100,000 in recent years. |
| San Diego County (Sheriff / Vera context) | Above 5,000 ADP in a county of about 3.3 million; works out to roughly 150 per 100,000 in rough terms. |
BJS notes that U.S. jail population fell during the COVID pandemic and has since trended back up, but not to the prior peak. California has tracked below the U.S. average for several years, in part due to realignment, Proposition 47, and Proposition 57. San Diego sits in line with other large urban California counties on a per-capita basis. The Vera Institute's county-level dataset lets researchers pull San Diego's rate and trend it back over time. For exact figures by year, the Sheriff's annual budget book and BJS data tables are the right cites.
Population Trends Over Time
San Diego jail counts moved sharply in the 2010s due to AB 109 realignment, then again in 2020 due to court closures and emergency release during COVID. The Detention Bureau publishes annual State of the Jails updates, plus news on smuggling drugs into jails, infrastructure spending, hospital partnerships, and care-standards modernization. These items mark the shifts in who comes in, how long they stay, and what care they get.
Three trend drivers stand out. First, statewide felony and sentencing reforms keep shifting which cases stay in county jail. Second, mental health needs at intake keep growing, which puts more weight on SDCJ. Third, reentry programs at East Mesa and Las Colinas have grown, with work, education, and job-skill tracks that aim to cut return-to-custody rates. The Sheriff also lists Veterans Moving Forward, the Job Center, and PRLA among its reentry resources, all of which can shift how long sentenced people stay in custody.
Searching for San Diego County Inmate Records by Name
This page covers aggregate jail population data, not name-based lookups. To find one person by name, use the Sheriff's Who's In Jail search through the San Diego County inmate records page, which links to the official portal and lists what fields the search needs.
Where the Data Comes From
Five sources feed this page. First, the Sheriff's Daily Population Report posts the per-facility, per-gender count each day. Second, the Detention Services Bureau page states the seven-facility footprint, the ADP, and the annual booking volume. Third, the Sheriff homepage "By the Numbers" panel lists yearly booking totals. Fourth, the federal BJS Jail Inmates series gives U.S. and state rates per 100,000. Fifth, the Vera Institute of Justice posts county-level jail incarceration data for trend work.
Two more layers come into play. The county grand jury reviews jail conditions each year. The Citizens' Law Enforcement Review Board (CLERB) reviews complaints and in-custody deaths. Both groups publish reports that touch on population mix, staffing, and care standards. For any number used in court, in a brief, or in a news story, the original Sheriff page, the Sheriff budget book, the BJS table, or the Vera dataset should be cited, not a third-party summary.